Panintelligence
Business Intelligence Dashboard
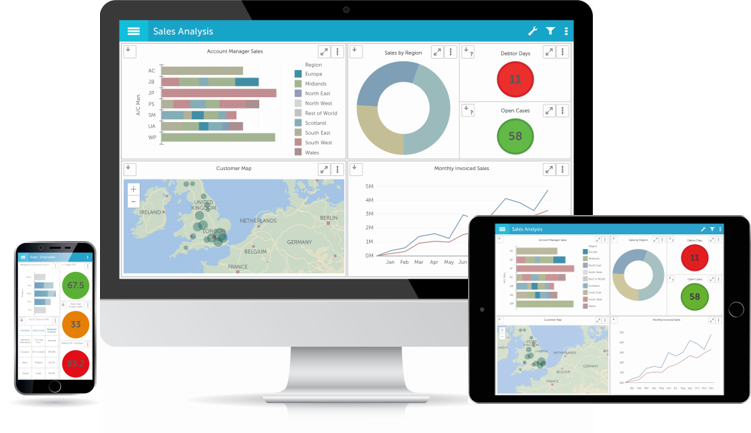
The Panintelligence dashboard is a business intelligence application that allows users to access their data in real-time, helping them to make better informed decisions. The dashboard software can summarise information held in multiple databases as a series of customisable and interactive charts, speedometers and tables.
Panintelligence For Salesforce
- Bring cloud and on premise data together in one place
- Highlight exceptions and trends in your Salesforce data
- Flexibility to configure reports suitable for your business
- Bring all of your data together within one reporting tool
- Access all of your data from anywhere
- Ability to drill into data for more detailed analysis
Panintelligence For
Sage
- One reporting tool for all databases in your business
- Charts across multiple companies in one view
- Tracks KPIs and automatically sends alerts
- Automatically email scheduled reports
- Share information with non-Sage users
- Drill out from the dashboard to another application
Product Features
The Panintelligence dashboard is constantly being enhanced, with comments and suggestions from users and potential users feeding into the development cycle.
Drag and Drop Interface
Drag and drop interface – Quickly build and adjust charts by dropping data elements onto the chart explorer window.
24/7 Access
The Panintelligence dashboard doesn’t require client software and is always accessible via PC, tablet and mobile device via a web browser.
Multiple Database Data
Access data from multiple databases – Panintelligence allows users to view data from different sources on one dashboard creating a single portal for all information.
Mult-tiered Security
Self-service with multi-tiered security – Users can make changes to the dashboard without the need for technical training and multiple security measures securely protect your data.
Dynamic Drilling
Dynamic Drilling – Non-linear exploration makes this feature a unique way to explore your data. Drill out to different charts depending on results or user-defined rules to get to the right information quickly.
Application Chaining
Application Chaining – This allows users to drill out from the dashboard to another application and pass a parameter, for example a stock number, from the dashboard to your warehousing software.
Why Choose Panintelligence?
- Unbeatable margins
- Dedicated single point of contact
- Short time to market
- Zero cost technical training
Brochures & Case Studies
Panintelligence for Salesforce
Panintelligence for Sage
Lunch and Learn
Review Panintelligence features over your lunch time. Our consultant will take you through an example of how reportive combines multiple sources of data, create chart or graph, data cube and dashboard.
Ready to discuss?
Our consultants are ready to address your business needs, simply give us a call, email or fill out our simple contact form and we will be in touch. If you would still like to learn more about Anderson Yates offerings, please continue to view all services.